Sympl features: what the dashboard does

Sympl is a fractional analyst for marketing teams. Its dashboard gives you a ranked list of what to fix, an AI chat that answers questions about your own data, and charts for AI Search Visibility, Ad performance, Website & conversion, and SEO & Search Console.

Ranked recommendations: what to fix first, and why

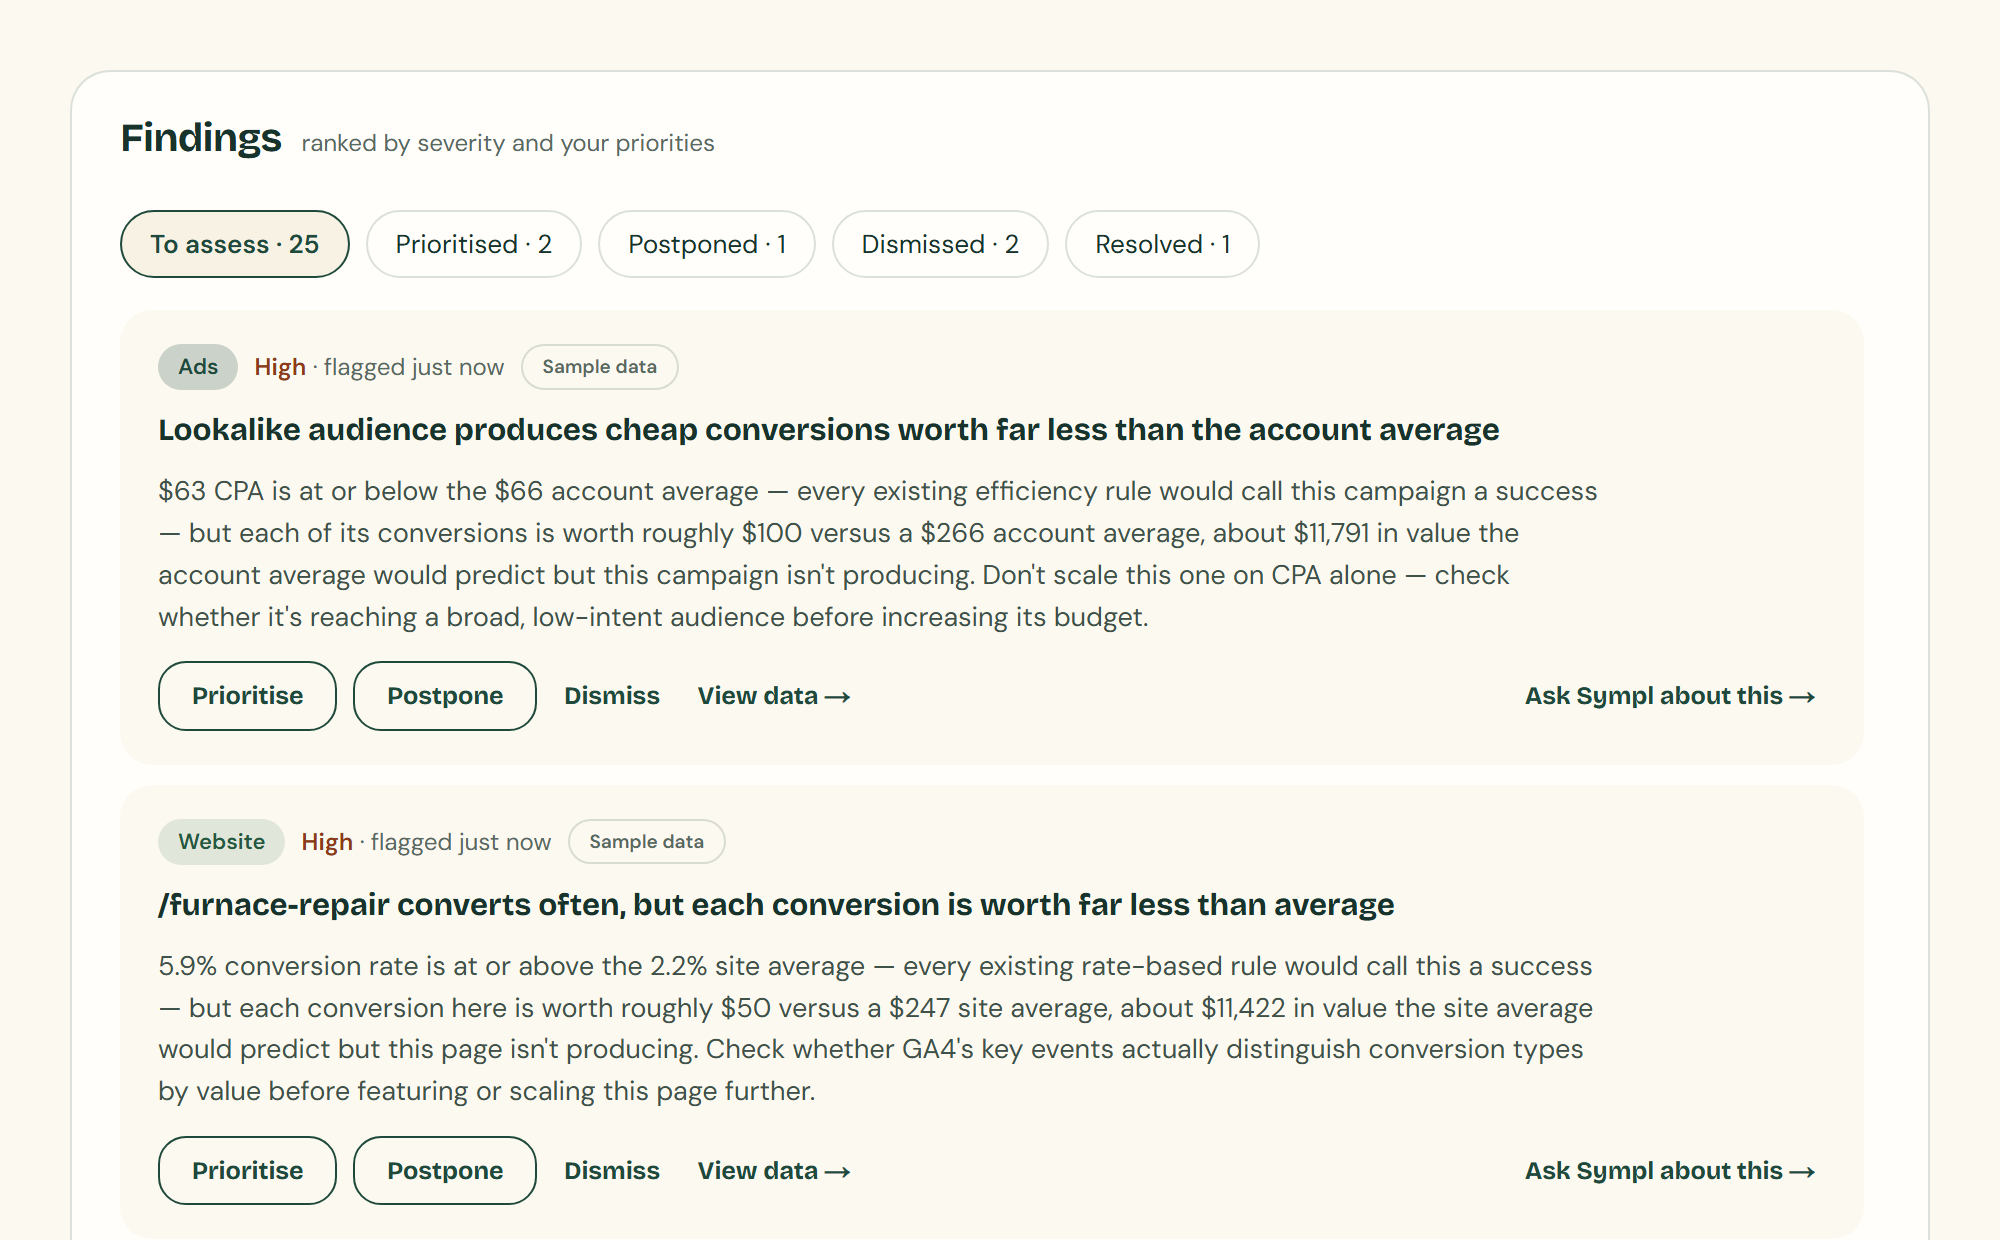
Sympl turns your connected data into a severity-sorted list of findings. Each one says what changed, shows the numbers and tells you what to do next. A to-do list, not a report.

The Findings list in the Sympl dashboard: ranked High-severity findings across ads, website and SEO, with tabs for To assess, Prioritized, Postponed, Dismissed and Resolved.
  • Sorted by severity and by your priorities

    Ordered High to Low. Findings that match your priorities rise to the top.

  • Evidence on every finding

    Every finding links to the data behind it. Check the claim before you act.

  • Prioritize, postpone or dismiss

    Mark each finding now, later or never. Dismissed ones stay out of the way.

  • Rules you can inspect, not a black box

    Fixed rules, so the same data gives the same finding. Ask Sympl why any finding fired.

Sample dataScreenshot of the Findings list in the dashboard, with illustrative numbers.

Plain-English chat that knows your data

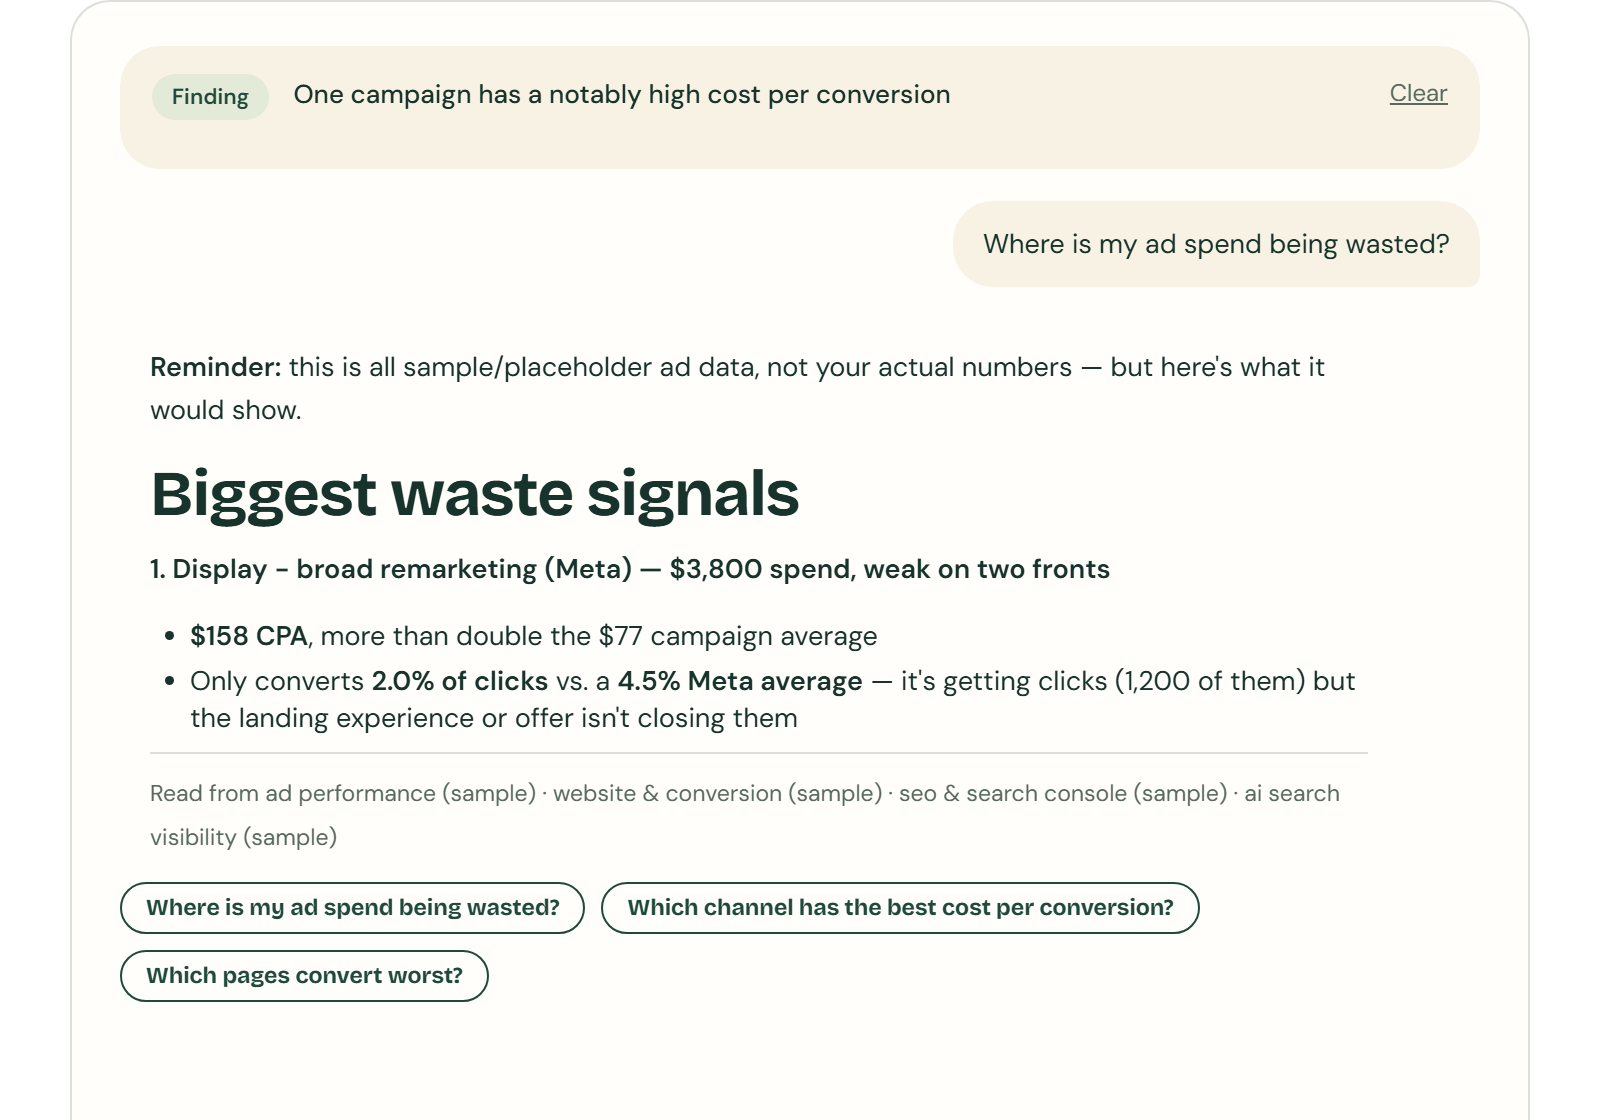
Ask Sympl a question in plain English and get an answer from your own marketing data. It reads only the modules you run, and says which ones it used.

A conversation in the Sympl chat: a finding pinned at the top, the question Where is my ad spend being wasted, an answer with numbers from the ad data, a line listing the modules it read, and suggested follow-up questions.
  • Grounded in your connected data

    Answers use your numbers, not a generic guess. Follow-ups keep their context.

  • Ask about a specific finding

    Every finding has an Ask Sympl about this button that opens chat on it.

  • Shows its sources

    Each answer lists the modules it read and flags any showing sample data.

  • Starter questions that fit your setup

    Suggestions follow your modules, so an SEO-only account never sees ad-spend questions.

Sample dataScreenshot of the chat in the dashboard, with illustrative numbers. The finding banner and answer are trimmed.

Visualizations built for decisions, not decoration

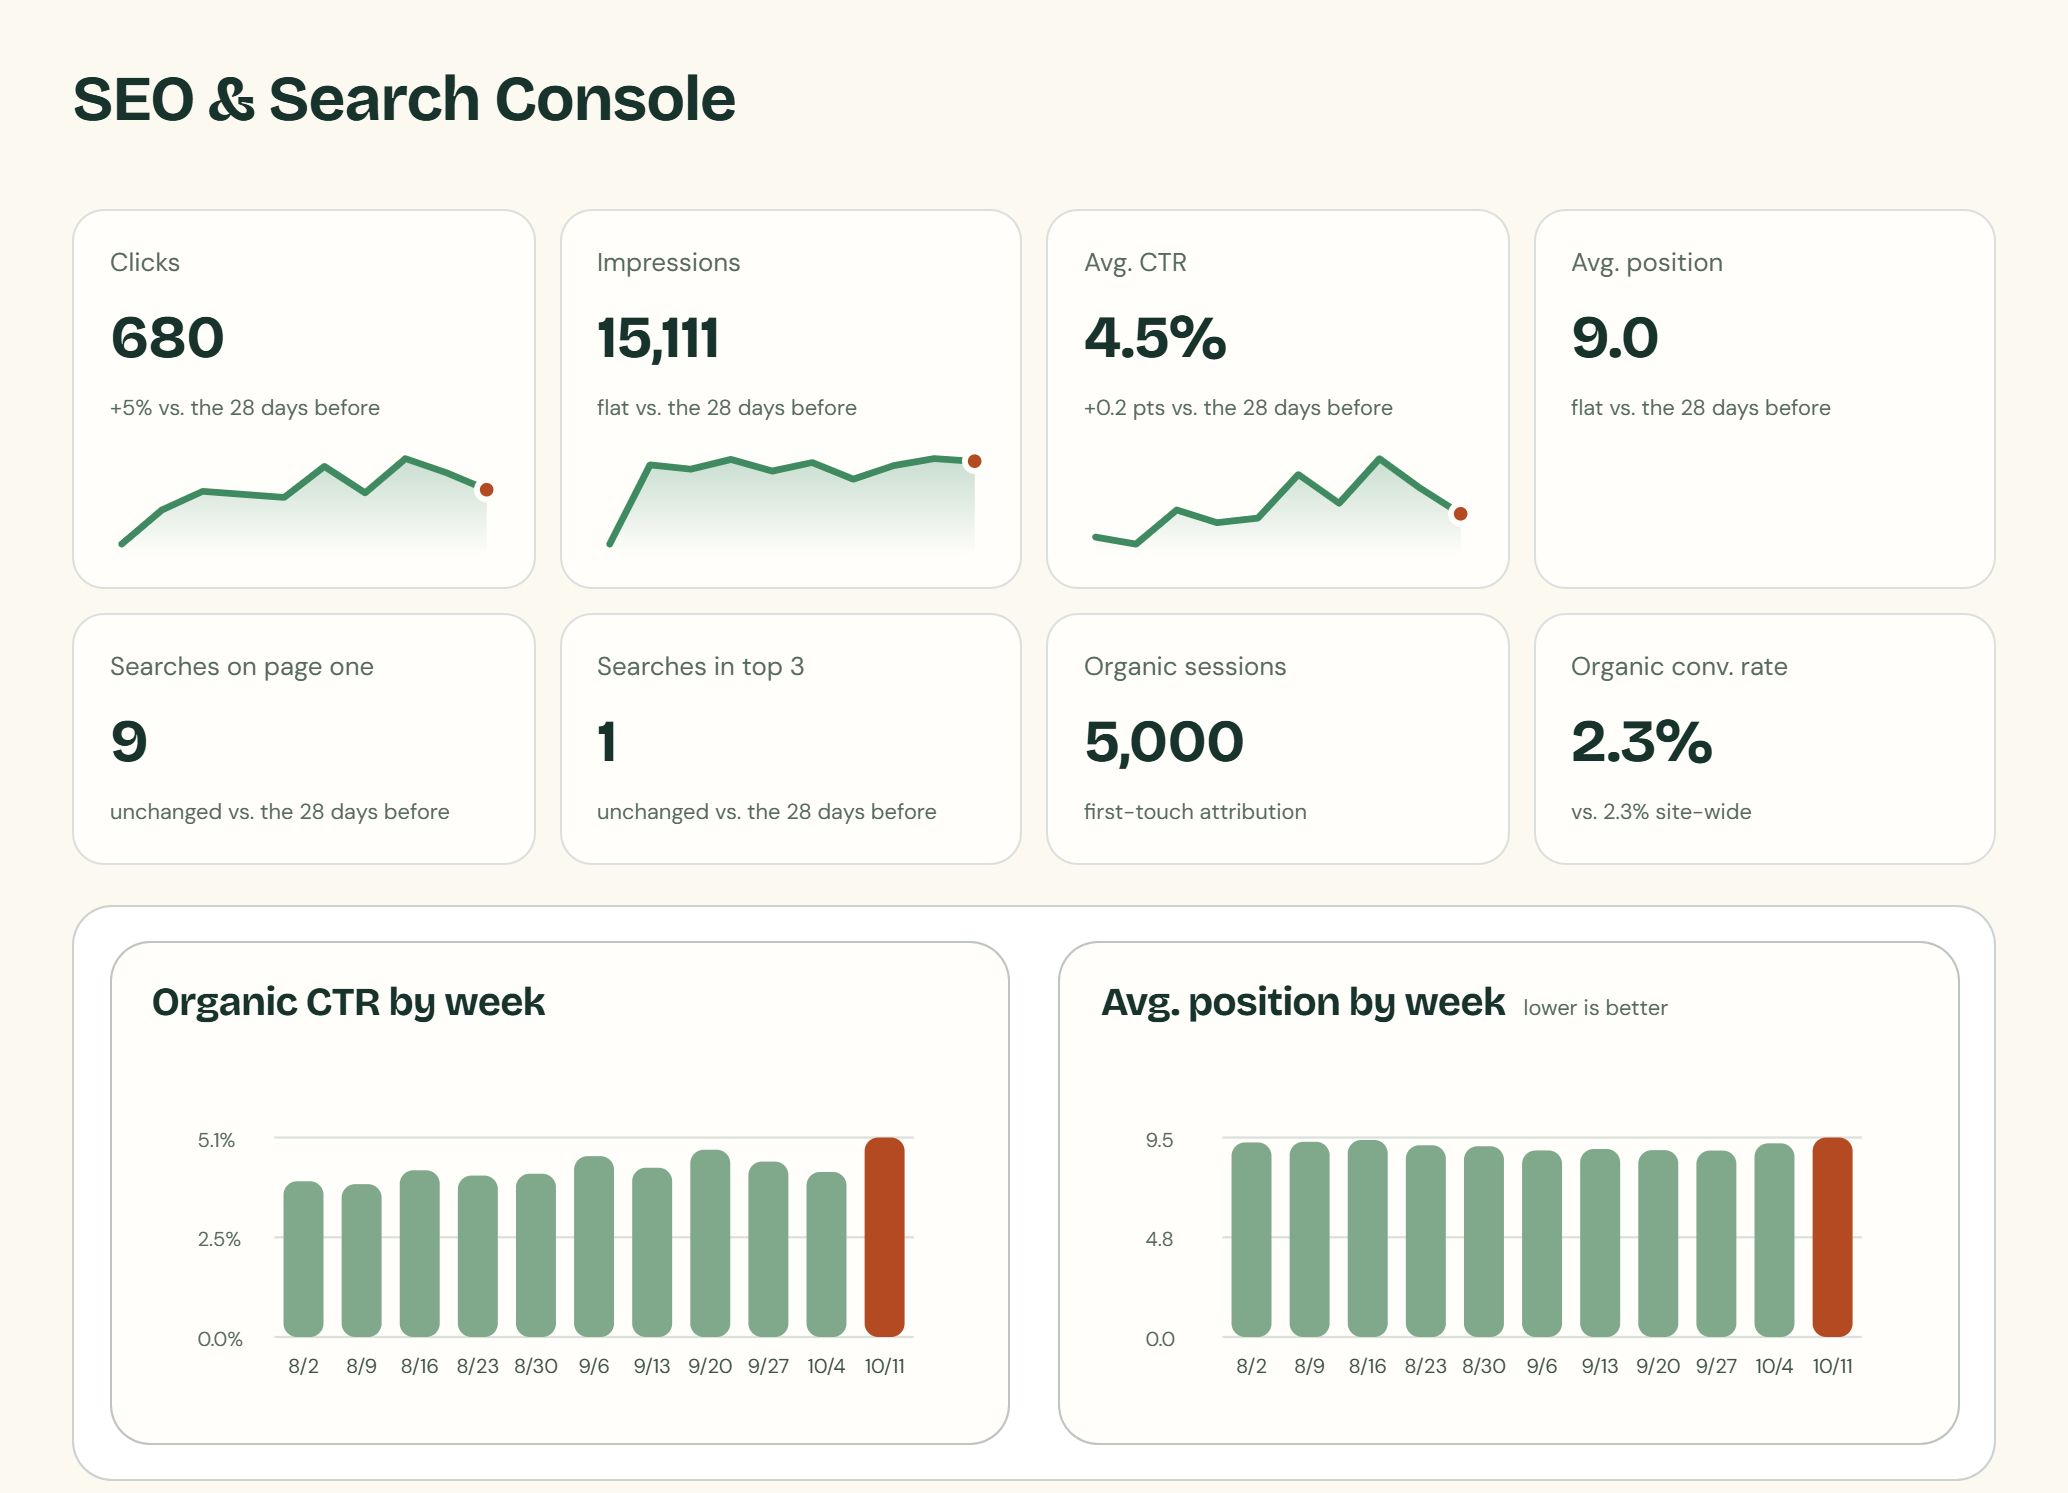
Every module opens with metric tiles and sparklines, then trend charts and breakdowns that show the story behind each finding.

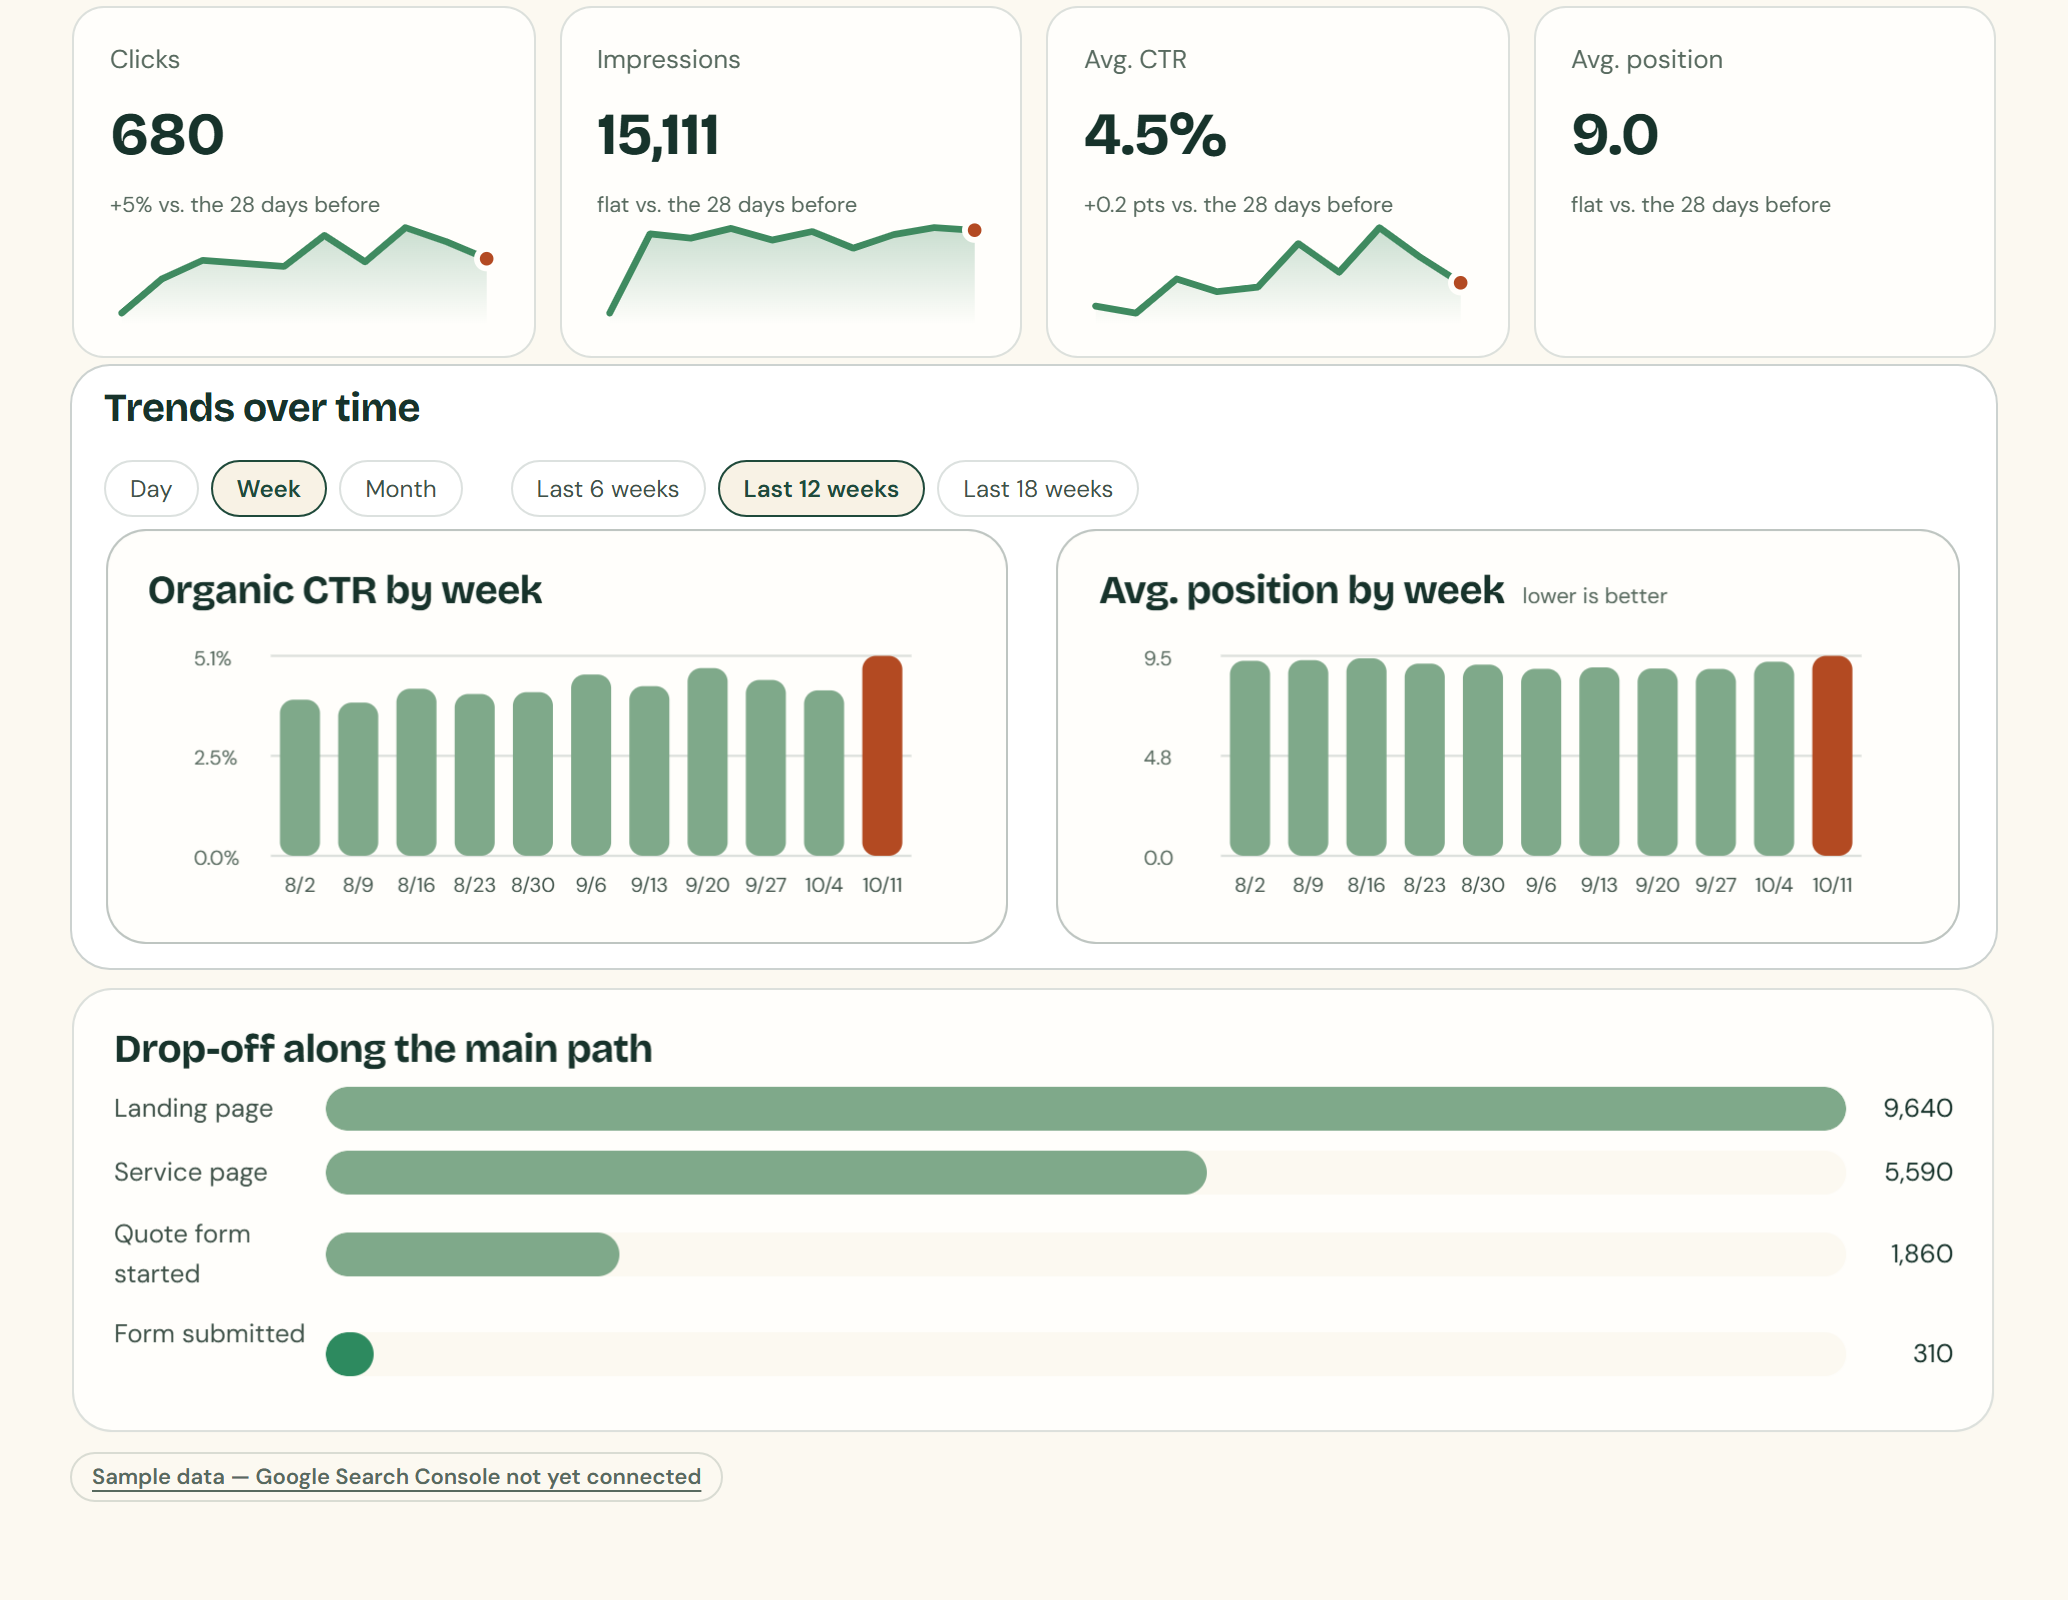
Dashboard charts in Sympl: a row of metric tiles with sparklines, a Trends over time control for day, week and month with two weekly bar charts, and a drop-off funnel from landing page to form submitted.
  • Metric tiles with sparklines

    The few numbers that matter, each with its recent trend.

  • Trend charts with a range control

    Switch between day, week and month. Longer ranges on paid plans.

  • Funnels and breakdowns

    See where visitors drop out, which pages convert and which campaigns waste spend.

  • Sample data is always labeled

    Illustrative numbers carry a Sample data tag wherever they appear.

Sample dataScreenshot of dashboard tiles, charts and a funnel, with illustrative numbers. Taken from two tabs and trimmed.

What Sympl watches in each module

You choose which modules to run. Each one has its own rules, listed here in plain language. A rule stays quiet until your data gives it something to say.

AI Search Visibility

Do ChatGPT, Perplexity, Gemini and Claude recommend us, or someone else?

Visibility

  • Your share of voice against competitors
  • Engines that never name you
  • Competitors recommended over you
  • Mentions slipping week over week

Citations and sources

  • Answers that name you but cite someone else
  • Sites that name rivals, not you, and how to get listed

Traffic

  • Visits arriving from AI engines
  • Mentions that never turn into visits

Ask the chat

  • “Which competitors do AI engines recommend instead of us?”
  • “Where would we need to be listed to show up in ChatGPT?”
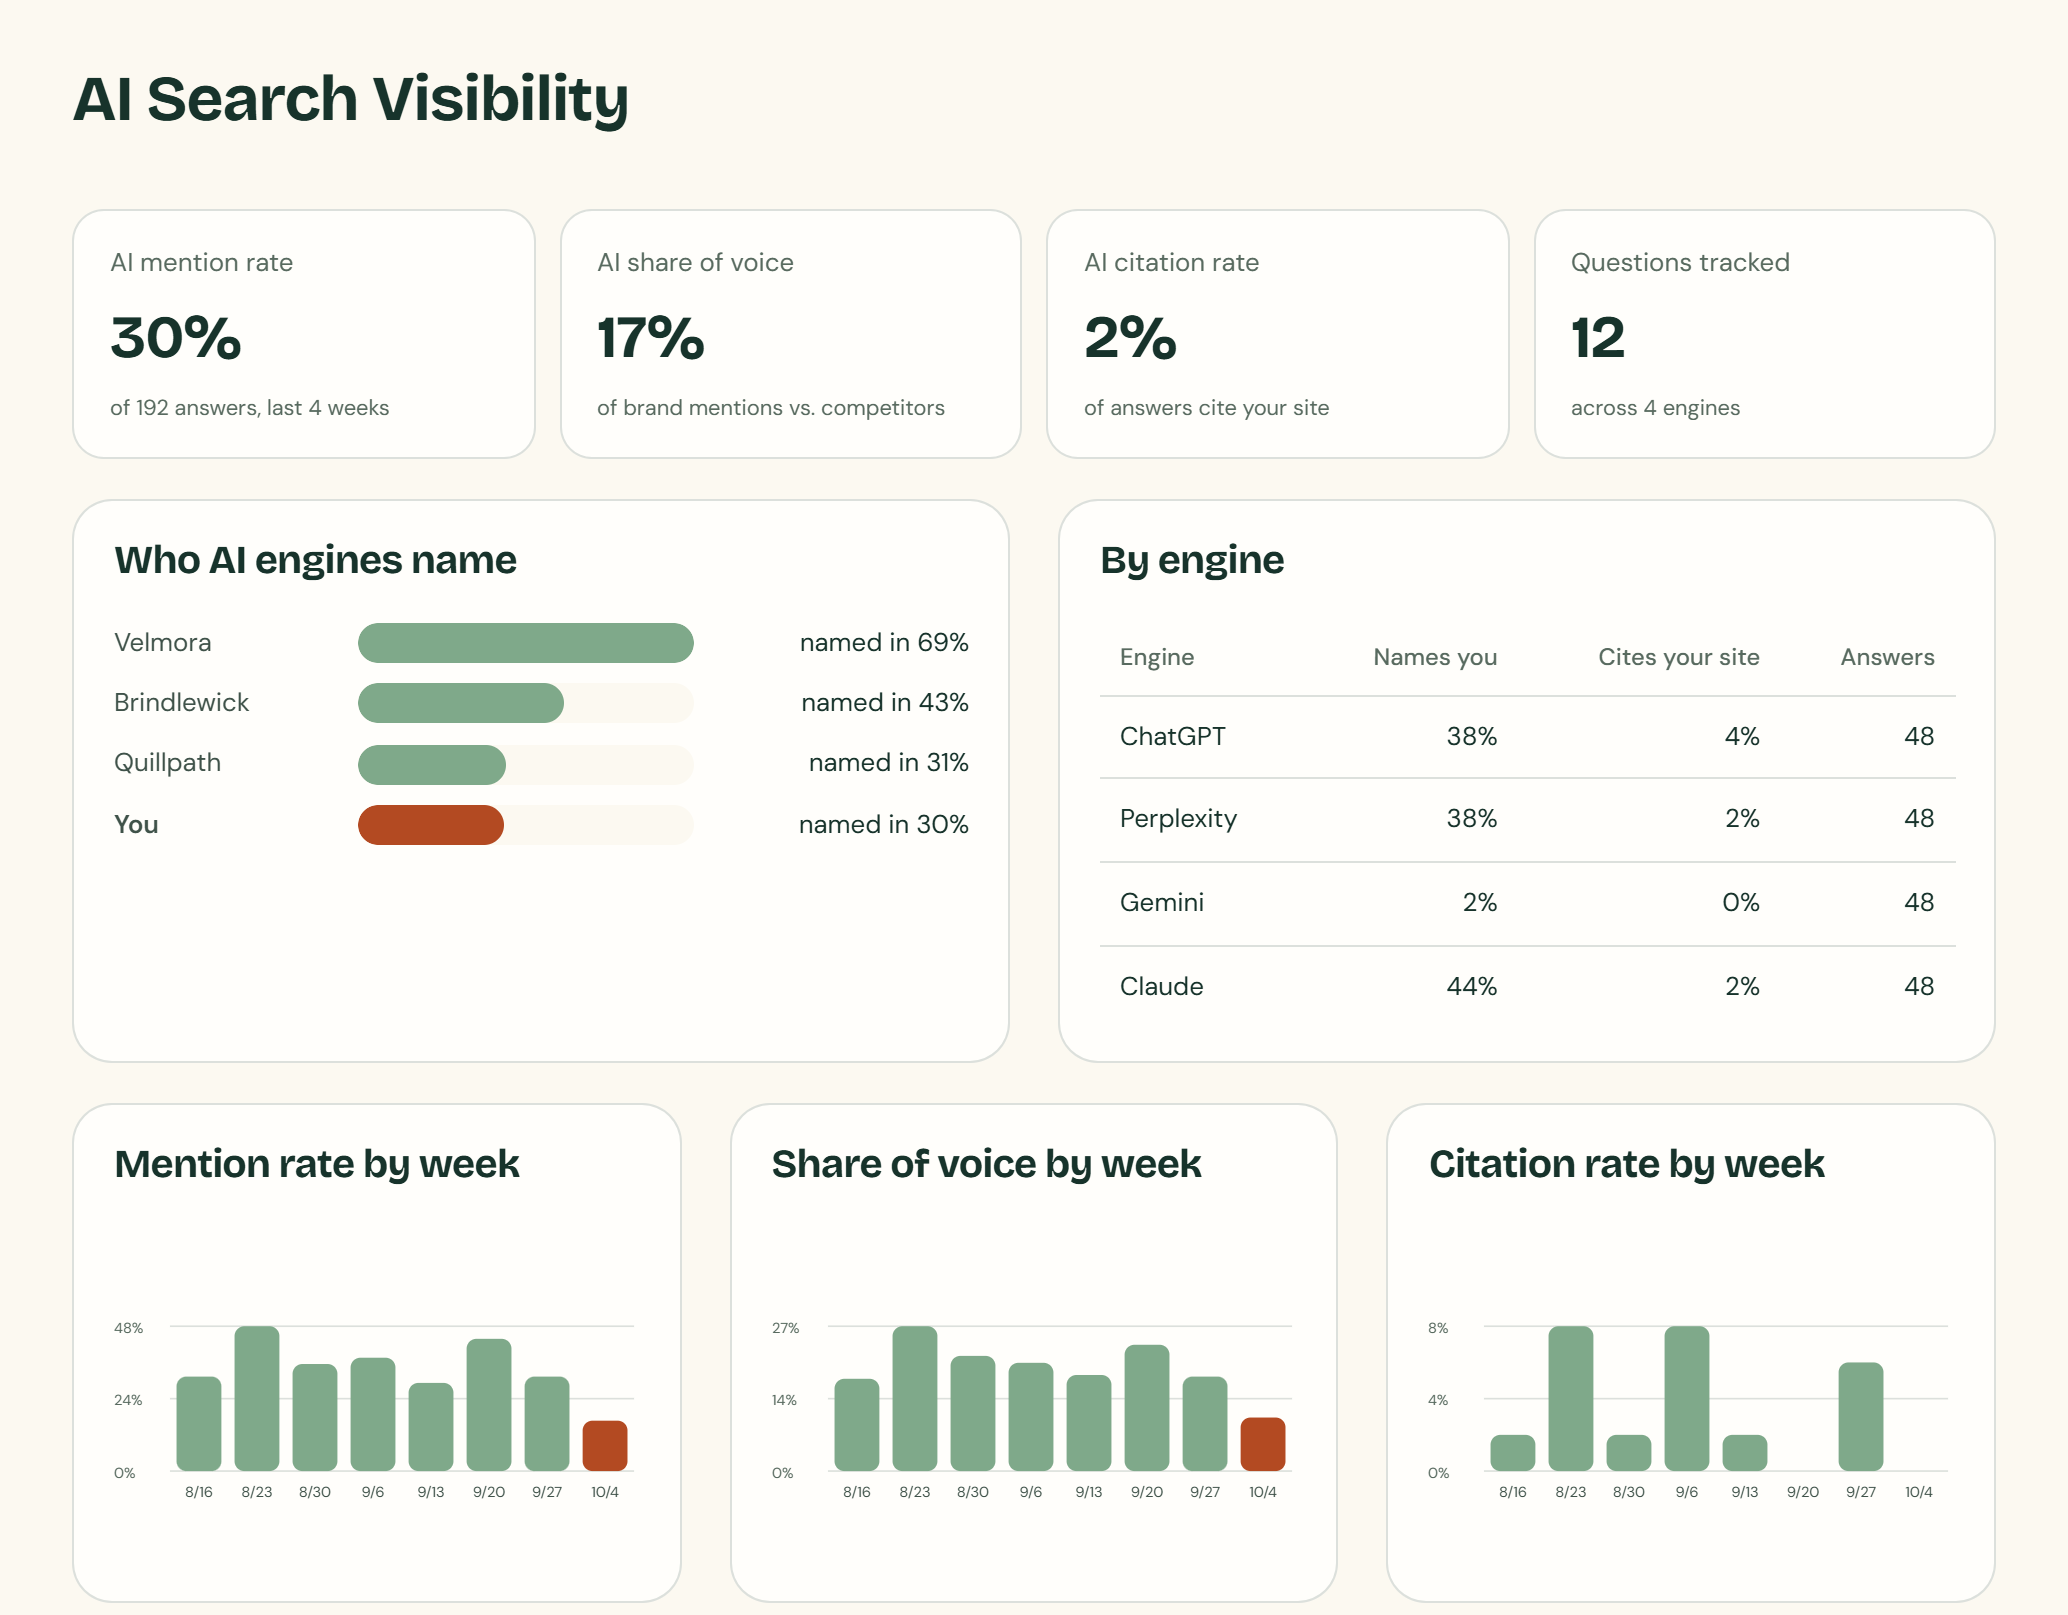
The AI Search Visibility tab of the Sympl dashboard: how often AI engines name the brand, share of voice against competitors and the sources they cite.
Sample dataScreenshot of the AI Search Visibility tab in the dashboard, with illustrative numbers.

Frequently asked questions

How does Sympl decide what to recommend?

Findings come from fixed rules run over your connected data, each with a severity. The same data produces the same finding, every finding links to its evidence, and rules stay silent until there is enough data to say something. The chat can then explain any finding in plain English.

Is the chat just a general-purpose AI?

No. It is given your own numbers and findings for the modules you run, and each answer states which modules it read from. It does not see data from other clients.

Which data sources does Sympl connect to?

Google Search Console for SEO, Google Analytics 4 for website behavior, and Google, Meta and Microsoft Ads for paid performance. AI Search Visibility needs no connection: Sympl asks the AI engines your buyer questions directly.

Do I have to run every module?

No. You choose which data areas to run, and the dashboard, findings, onboarding steps and chat follow that choice. An account that only connects Search Console and Google Analytics sees only organic-search findings.

Will I ever see made-up numbers?

Only when clearly labeled. If a module is showing illustrative data instead of yours, a Sample data tag appears wherever it is shown.

How do AI answers in AI Search Visibility compare to what I see in ChatGPT?

Sympl asks the engines through their APIs, which are not identical to what a signed-in person sees in the consumer app. The dashboard says so next to the data, and the weekly trend is the useful signal.
See the plans and prices or how Sympl compares with hiring an analyst.

Ready to see this on your own data?

Start a free 14-day trial — live on your own data in under two hours.